Explore your data: Make the most of custom reports
Custom reports enable you to easily access and organize your raw data to more deeply explore your data and answer important audience questions.
A core feature of Metrics for News (MFN) is our Custom Reports dashboard, which allows you to create comparison reports that mix and match your data to help you hone in on specific metrics that offer valuable insights for your newsroom. It’s a feature not often accessed by our average users but is a favorite among our super users.
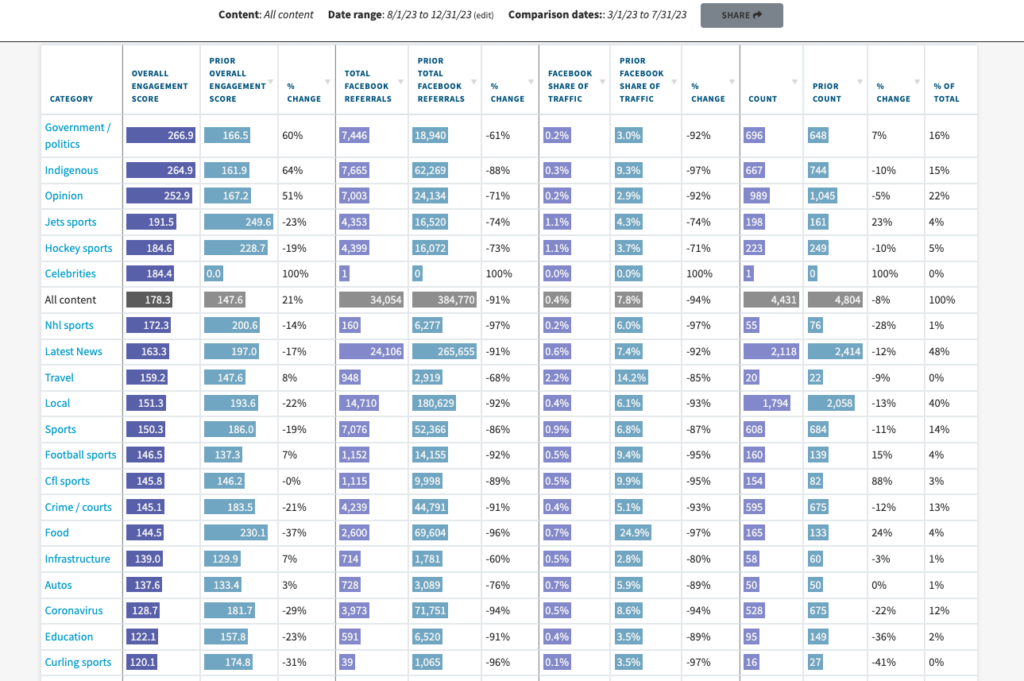
Chart 1: A Canadian newsroom’s custom report looking at drop in Facebook referral traffic after the platform started blocking news for users in mid-2023.
For example, you might want to know the topics, beats or story types that are bringing people to your website, or engaging key subsets of your audiences such as new, or loyal, subscribers. This type of analysis allows you to see trends in your audience engagement and zero in more distinctly on what journalism is driving people to subscribe and stay subscribed.
You can also easily download these reports into CSV files and play with them in your favorite spreadsheet tool to create charts and graphs to help explain the numbers to key stakeholders.
We used custom reports with one of our Canadian newsroom partners to explore the impact of Facebook removing news from Canadian news sites from their platforms last year. The data in Chart 1 shows you the impact that change had on not just Facebook traffic, but social referrals as a whole.
With custom reports it was easy to quickly see that the impact was a dramatic change in total social traffic, with some core news categories like weather, business, and world news, seeing a drop of more than 90 percent.
While news hasn’t been removed from platforms in the US, publishers are seeing declines due to a general deprioritization of news for key social platforms. For your newsroom, what has been the impact? With custom reports you could answer this question for any of the social platforms you track in your analytics.
Playing with your data
Crain Communications uses Metrics for News in 14 newsrooms, and has used the data they get from custom reports to improve newsletters, help reporters improve their beats, and even launch a newsroom.
“We’re huge fans of custom reports,” said Elizabeth Couch, director of audience engagement, Crain City Brands, who said many questions about story performance and audience engagement can be answered through MFN’s built-in dashboards around topics, audiences, and loyalty stages.“But I’m really looking at much bigger trends and solving mysteries when I go into custom reports.”
Custom Reports is the place to go when you just want to see daily, or weekly, trends, or do a gut check on what were our top stories last week,” added Couch.
And, while Adobe Analytics and Google Analytics offer a lot of powerful insights into your reader traffic data, they can be overwhelming to navigate and often inaccessible to newsrooms and reporters. The beauty of MFN’s custom reports is that it can help you hone in on what is most important and surface details that aren’t readily available in analytics.
Matt Pollak is an audience engagement editor at Crain’s Detroit and he spends a lot of his time working with reporters “to help them use metrics to inform their coverage in a useful way.”
[Chart 2: Crain Detroit’s custom report that tracks three key KPIs: reach, conversion and retention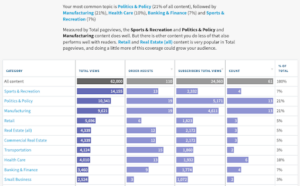
Even though stories may not perform well with all three of those metrics, it doesn’t mean they aren’t engaging readers. And how they run custom reports allows them to surface these details for reporters. For example, a story might not have had great reach but did well in conversions or retention, said Pollak.
“A story that maybe didn’t tear the world apart on page views, led the week in assists — and we see that more often than not. [For example], we found in my newsroom that cannabis stories maybe don’t always lead in page views, but they do really well with [subscription conversions],” said Pollak. “What that has told us is maybe we’re owning that space a little better than the competition.”
“This gives us two other ways to show that yeah your story was important or you know we’re really gonna have to reassess why you’re doing stories like this if they’re not mission critical and they’re not checking any of these three boxes,” added Couch. “It’s where we go to spot big trends. I have a lot of corny phrases that I use in my newsrooms but we talk a lot about winning the day, winning the week, and winning the month — winning big. We’re using MFN to figure out how an entire beat, a reporter, a story form can succeed.”
If you have a trusted custom report that you run regularly, email us and let us know! We’d love to share it.
* Assists, or order assists, is a metric in Adobe Analytics that measures the impact of an engagement channel or touchpoint that converts readers to subscribe.
READ MORE FROM:Case studies & Resources